Institutional Execution Overview
Discover why diagonal trendlines are algorithmic stop-loss traps on Gold. Learn how to trade the cascade into extreme unmitigated wick zones.
Key Takeaways
- Trendlines are runways of liquidity: Diagonal trendlines do not act as support; they serve as a continuous trail of stop-losses engineered for cascade harvesting.
- The Liquidity Cascade: When a trendline breaks, cascading stop-loss orders generate the momentum needed to reach the true institutional Point of Interest.
- The Unmitigated Wick: The virgin shadow of an impulse candle holds institutional unfulfilled orders that must be mitigated before trend continuation.
The Illusion of Diagonal Support
In classical retail technical analysis, traders are taught to connect three higher lows and call it an “ascending trendline.” Whenever price touches this line, retail traders buy, placing their stops just a few pips beneath the diagonal angle.
+--------------------------------------------------------------------------+
|                       THE TRENDLINE LIQUIDITY (TLQ) TRAP                 |
+--------------------------------------------------------------------------+

                      [ Swing High: $2,735 ]
                                 ▲
                                / \
      Trendline (TLQ)          /   \    [ Aggressive Cascade Breakdown ]
             /                /     ▼
            /                /       \  Retail Panic Selling
           /   Touch 2      /         ▼
          /    ($2,718)    /           \
         /       ▲        /             ▼
        /       / \      /         [ Cascading Stops Hunted ]
       /       /   ▼    /                       ▼
  Touch 1     /   Touch 3                [ EXTREME UNMITIGATED WICK ]
  ($2,712)   /    ($2,722)               [ $2,705.00 - $2,707.50 ]
    ▲       /       ▲                               ▲
    |______/________|                               └── Institutional Accumulation Point
    Stacked Stop-Losses (TLQ Runway)
In institutional algorithmic trading, diagonal lines are recognized as Trendline Liquidity (TLQ).
Every touch of a trendline does not make it stronger; it makes it weaker, because each touch accumulates more retail stop-loss volume underneath it. When institutional desks need to accumulate large buy orders at discount prices, they deliberately push price down through the trendline.
Anatomy of the Cascade into the Unmitigated Wick
- The Break: Price snaps below the trendline. Retail trend followers panic and sell at market, while breakout traders open new short positions.
- The Cascade: The cascade of triggered sell-stops creates an instantaneous liquidity waterfall.
- The Unmitigated Wick Destination: Price plummets straight into the Unmitigated Wick—the origin of the macro impulse that started the trend days earlier.
- The V-Reversal: Once the institutional buy limits resting at the extreme wick absorb the selling deluge, the market forms a violent reversal.
Detailed Trade Blueprint: Bullish TLQ Reversal Setup
- Asset: Spot Gold ($XAUUSD)
- Analysis Timeframe: M5 | Trigger Timeframe: M1
• Context: Ascending trendline touching at $2,712.00, $2,718.00, and $2,722.00.
• Higher High printed at: $2,735.00.
• Target Institutional Zone: M5 Unmitigated Wick Demand at $2,705.00 – $2,707.50.
Execution Steps:
- The Hunt: At 13:30 GMT (NY Session), Gold collapses through the trendline at $2,720.00. Retail traders attempt to short the breakdown.
- The Absorption: Price cascades directly into the unmitigated wick at $2,706.20. On the M1 chart, price prints three rejection wicks and an aggressive Market Structure Shift (MSS) bullish candle closing at $2,708.50.
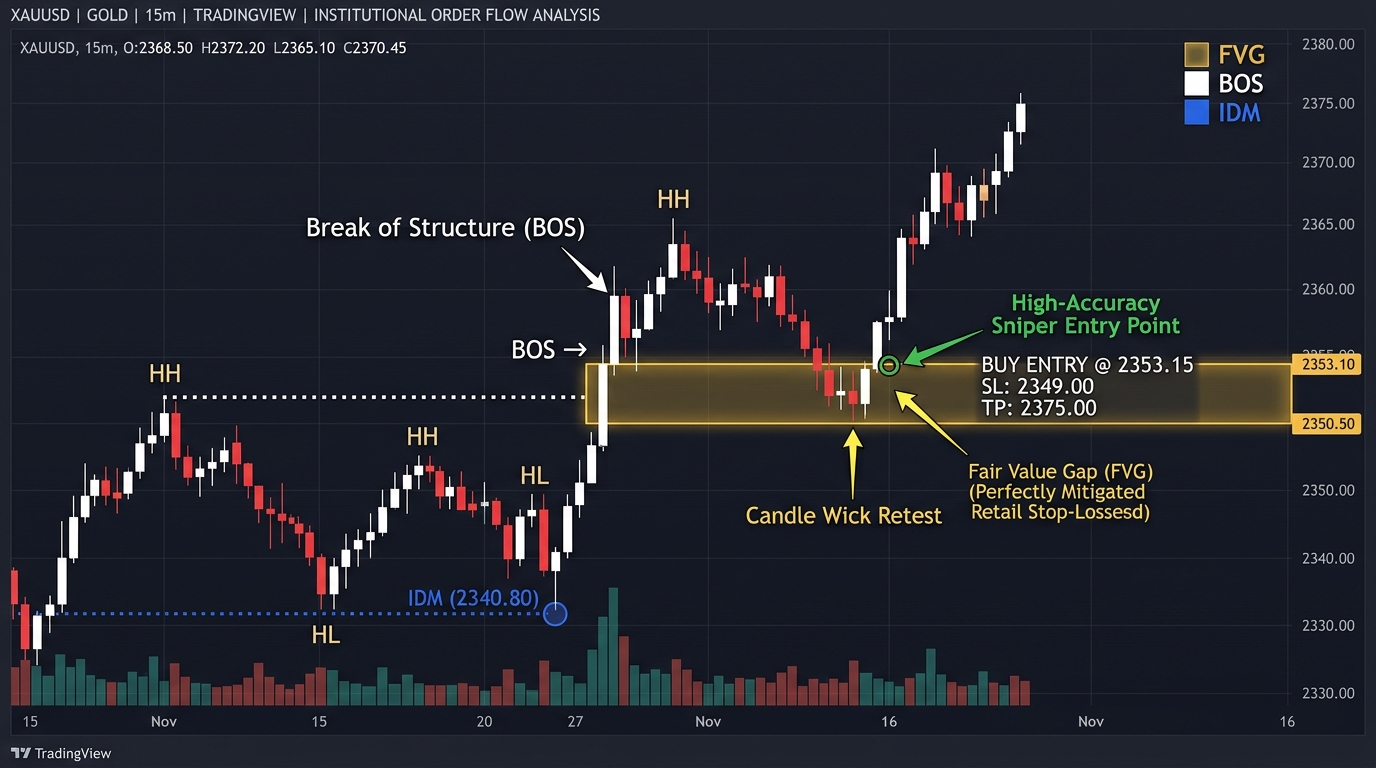
- The Entry: Place a buy limit on the retest of the M1 Fair Value Gap created by the displacement candle.
• Execution Type: Limit Order Retest
• Entry Price: $2,707.80
• Invalidation (Stop Loss): $2,704.50 (33 pips — below unmitigated wick apex)
• Take Profit 1: $2,719.00 (+112 pips — Broken Trendline Retest Zone)
• Take Profit 2: $2,735.50 (+277 pips — Liquidation of Swing High Buy-Stops)
• Risk/Reward Ratio: 1 : 8.39
⚡ Automated Algorithmic Power: ATGOLDEN Expert Advisor
Every institutional sweep parameter and risk model explained in this guide is natively coded into the ATGOLDEN MT5 Expert Advisor for automated precision execution on Gold (XAUUSD).
Explore & Acquire ATGOLDEN EA ➔