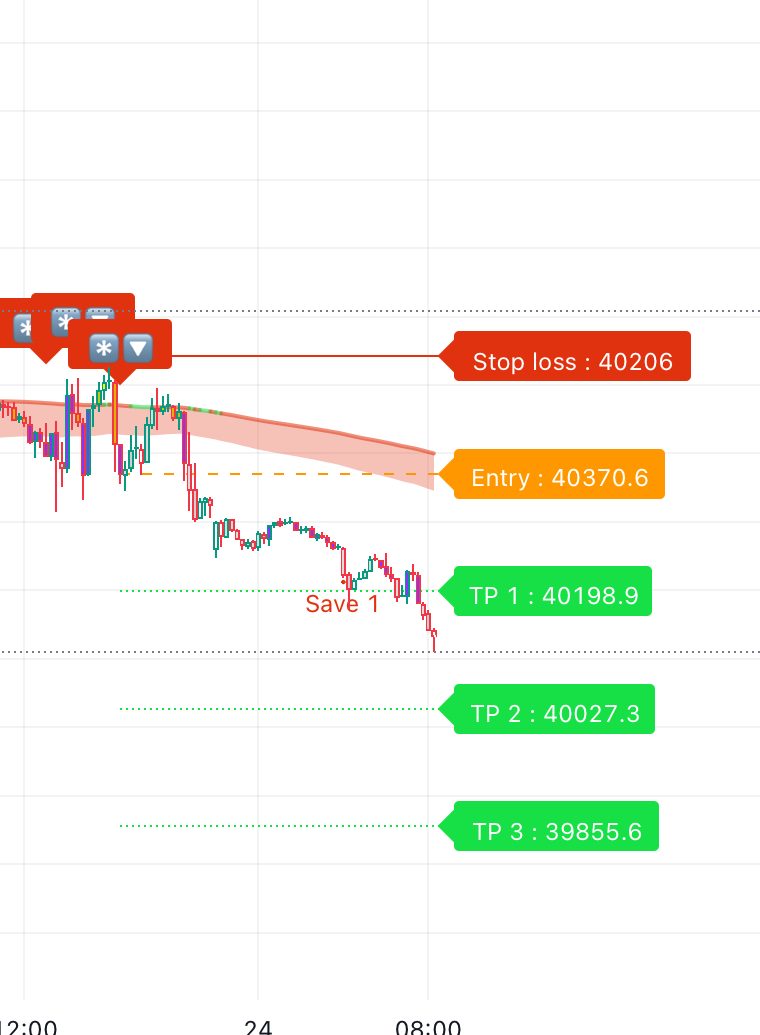
How it works
Signal Settings
Signal Display: Option to show or hide buy and sell signals.
Sensitivity: Adjusts signal sensitivity using input values.
Presets: Choices include “All Signals”, “Strong+”, and “Trend Scalper”.
Signal Filters
Trend Signal Filter: Shows only trend signals.
Strong Signal Filter: Displays only strong signals.
High Volume Signal Filter: Shows only high volume signals.
Contrarian Signal Filter: Displays only contrarian signals.
Candle Color Settings
Heatmap: Adjusts candle colors to indicate market sentiment.
No Momentum Candles: Option to show or hide candles without momentum.
Trend Tracer
Exponential Moving Average (EMA): Uses EMA for trend filtering.
Trend Cloud Display: Shows trend cloud on the chart.
Risk Management
Profit/Loss Areas: Displays profit and loss areas on the chart.
Trailing Stop Loss: Shows trailing stop loss.
Take Profit Settings: Configures multiple take profit levels.
Pullback Signals
Pullback Signal Display: Shows pullback signals based on user settings.
Alerts
Buy/Sell Alerts: Sets normal and strong buy/sell alerts.
Stop Loss and Take Profit Alerts: Configures stop loss and take profit alerts.
Use of Algorithms
This indicator employs various algorithms such as moving averages, Relative Strength Index (RSI), and wave analysis to detect trends and signals. For example:
RSI: Uses exponential moving average of RSI to identify buy and sell points.
ATR: Utilizes Average True Range for determining stop loss and take profit levels.
Wave Analysis: Employs wave analysis for detecting pullback signals.
AI propeht TradingView